Re: No useful callgraphs on Fedora 27
- From: Clemens Eisserer <linuxhippy gmail com>
- To: sysprof-list gnome org
- Subject: Re: No useful callgraphs on Fedora 27
- Date: Tue, 13 Feb 2018 09:48:49 +0100
Hi Christian,
No debug symbols for Xorg needed to be installed and I
still had various functions I know are part of Xorg in the callgraph.
The functions are there, but there is no way to deduce who is the main
caller of an expensive function.
Funny enough, the sysprof-homepage has example screenshots which
illustrate exactly what I was hoping for - a screenshot of an Xorg
profile, where one can clearly see which function consumed how much
cycles: http://www.sysprof.com/screen-shot-2.png

In my profile, I can see some mesa functions consuming most cycles,
but I dont have any clue which Xorg rendernig function called it.
So I see _mesa_streaming_load_memcpy is on top, but was it caused by
ProcRenderText or ProcPoly...:?

Funny enough, when profiling wine/i386 code, I get exactly what I am
hoping for: http://93.83.133.214/sysprof_wine.png

So I guess there is no way arround compiling Xorg + Mesa myself.

Thanks & best regards, Clemens

2018-02-12 12:51 GMT+01:00 Christian Hergert <christian hergert me>:
On 02/12/2018 01:33 AM, Clemens Eisserer wrote:
My system has selinux as well as the meltdown/spectre mitigations
turned off - however could it be some of the security enhancements
introduced in the past (ASLR, ...) could cause these issues?
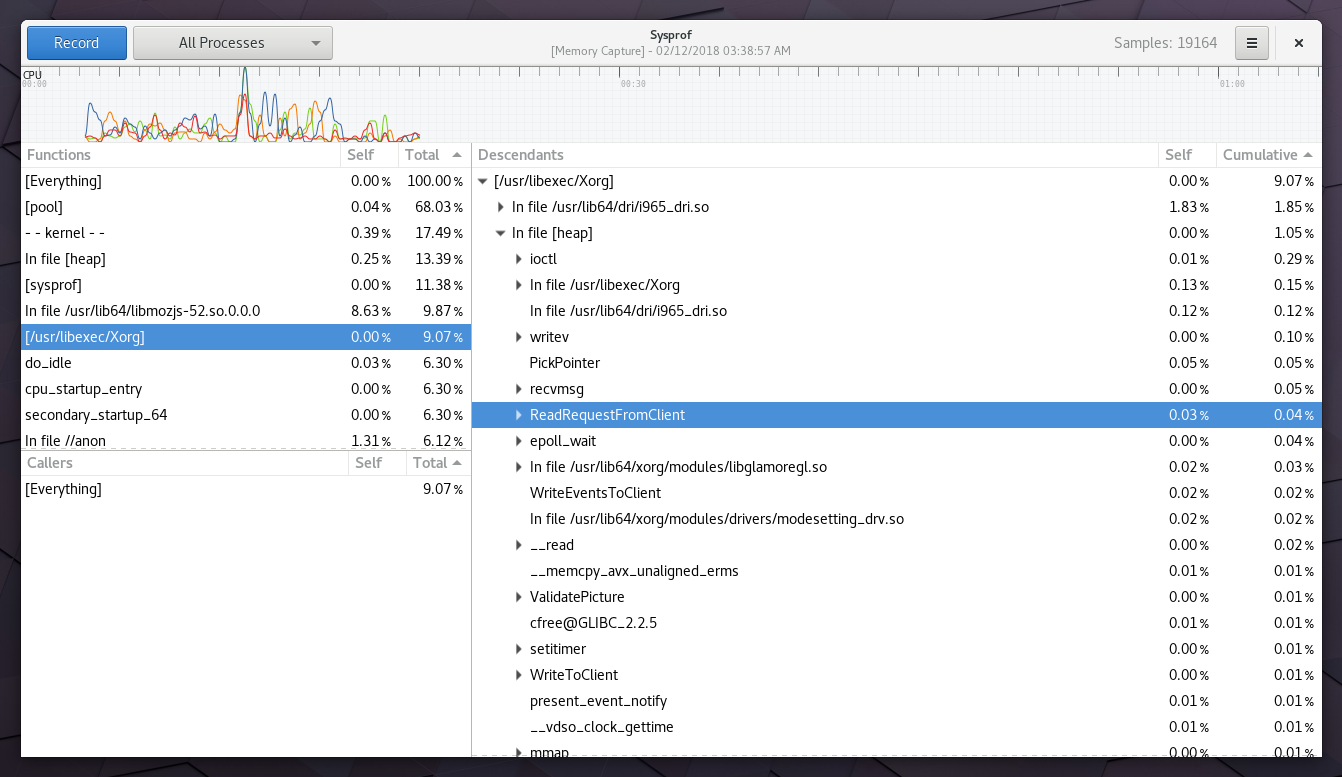
Not sure, but I just booted into Xorg on rawhide and tested with Sysprof
from git-master. No debug symbols for Xorg needed to be installed and I
still had various functions I know are part of Xorg in the callgraph.

  http://hergert.me/tmp/xorg-capture.png

-- Christian
[
Date Prev][
Date Next] [
Thread Prev][
Thread Next]
[
Thread Index]
[
Date Index]
[
Author Index]
