
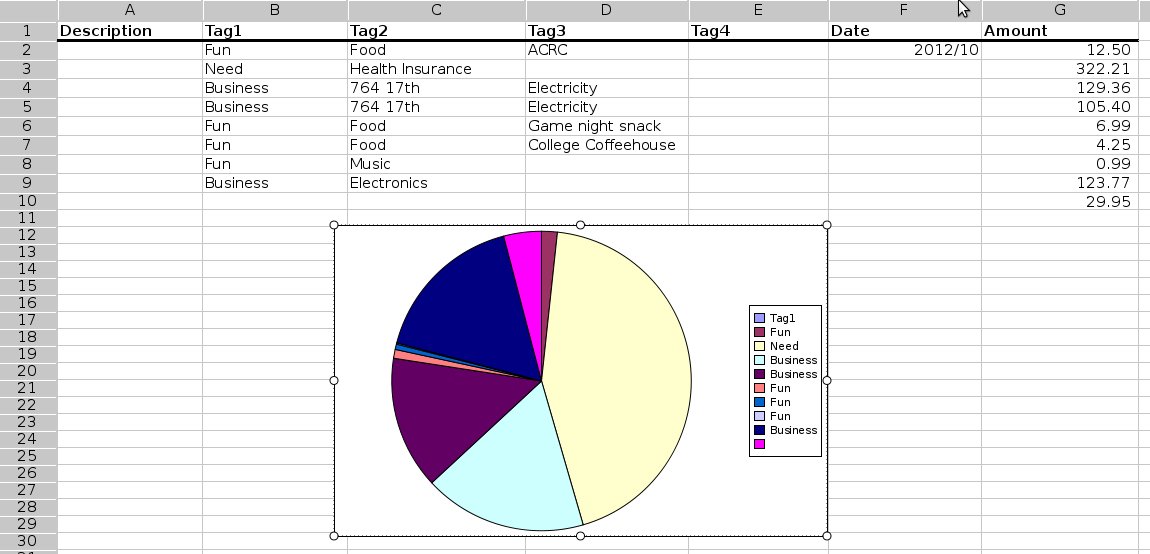
Hi folks,

I was going to use gnumeric as a way to keep track of my expenses.

The attached screenshot shows the trouble best, but here's a description:

The plan was to create one row per expenditure, with some classification
tags, so I could then make pie charts and such to keep an eye on things.

Unfortunately the pie chart doesn't do what I want: it give me one slice per
row, rather than one slice per category.

Any pointers to the easiest way to get what I'm going for?

Thanks,
Britton
Attachment:
bad_pie.jpg
Description: JPEG image