
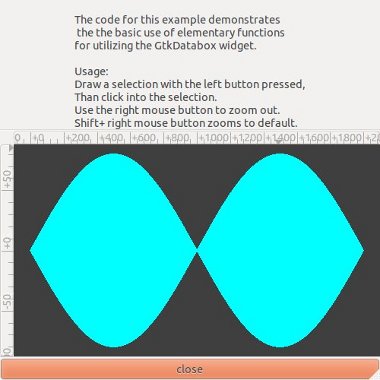
Hi there,

I would like to add a new type of graph to gtkdatabox.
What do you think of a gtkdatabox_region type of graph ? See the attachment.
It would let you plot a region of colour on the graph - similar to the gtkdatabox_bars graph, however allowing two Y points for each X.
In this way, a region of colour may be plotted.
Currently gtkdatabox_bars sets the bar region like so :
      data->x1 = data->x2 = gtk_databox_value_to_pixel_x (box, *X);

      data->y1 = zero;

      data->y2 = gtk_databox_value_to_pixel_y (box, *Y);
I would think that the gtkdatabox_region graph would do something like
this instead :
      data->x1 = data->x2 = gtk_databox_value_to_pixel_x (box, *X);

      data->y1 = gtk_databox_value_to_pixel_y (box, *Y2);

      data->y2 = gtk_databox_value_to_pixel_y (box, *Y);


What do you think ?

I have already tested this method and it is attached.

Matt
p.s. I previously posted this message, but the attachments were too
large, so I am resending with a smallest attachment!
Attachment:
gtkdatabox_region.smallest.jpg
Description: JPEG image