
I was wondering that it would be really nice to be able to make
circular histograms in Gnumeric (aka rose plots or diagrams)
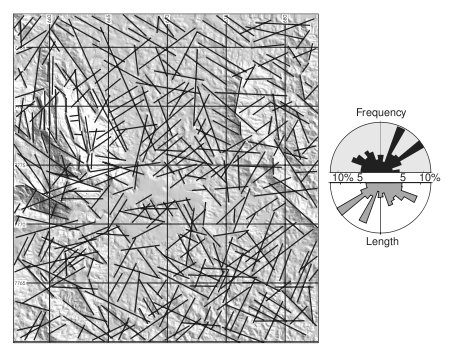
At least in geology, we usually make those plots in two ways: from a
dataset of (azimuth,length) of lines (geological structures), we
create the diagrams with the petals (histogram bin) weighted eitehr by
azimuth frequency or by line length. See the attachment for an
example. That is a "post-processed" version, where I joined the two
kinds in one figure. Normally we get the whole circle rose or the
upper half.
cheers
Carlos
--
+-----------------------------------------------------------+
Carlos Henrique Grohmann - Guano
Visiting Researcher at Kingston University London - UK
Geologist M.Sc - Doctorate Student at IGc-USP - Brazil
Linux User #89721 - carlos dot grohmann at gmail dot com
+-----------------------------------------------------------+
_________________
"Good morning, doctors. I have taken the liberty of removing Windows
95 from my hard drive."
--The winning entry in a "What were HAL's first words" contest judged
by 2001: A SPACE ODYSSEY creator Arthur C. Clarke
Can't stop the signal.
Attachment:
rose.jpg
Description: JPEG image