Re: No useful callgraphs on Fedora 27
- From: Clemens Eisserer <linuxhippy gmail com>
- To: sysprof-list gnome org
- Subject: Re: No useful callgraphs on Fedora 27
- Date: Mon, 12 Feb 2018 10:33:02 +0100
Hi Christian,

Sorry for turning into a support-vampire, this was never my intention.
Since you've mentioned debian, you may want to see if debian testing
works better. I know Debian had miss-packaged¹ Sysprof for quite a while
and I do not know if their fixes made it from unstable→testing→stable.
I have now also tested debian-testing amd64 and debian-9.3 (stable)
for i386 without success.
If you have public ABI you're calling in a library, perf can usually get
that data just fine.
The funny thing is the kernel-stack is fine, only the userspace
callgraphs don't make any sense to me.
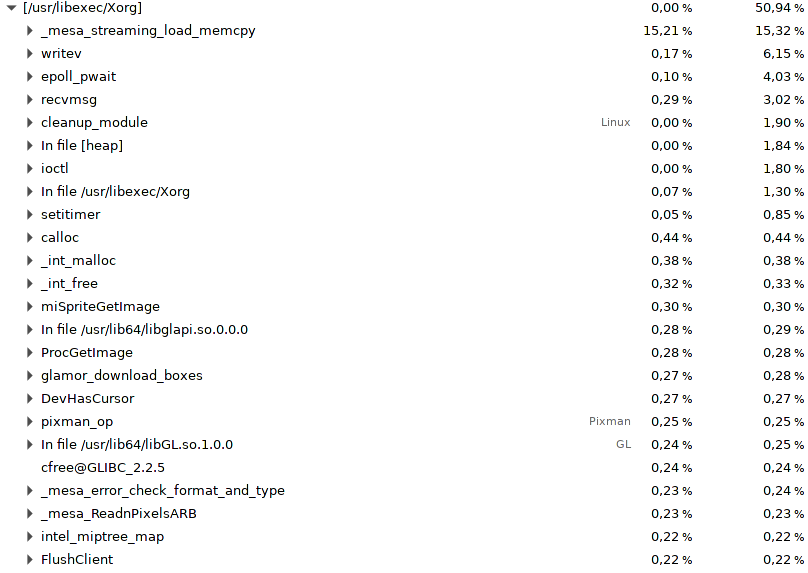
All I want to profile is XOrg (no dynamically generated / jitted
code), yet all I get is: http://93.83.133.214/sysprof_xorg.png
http://93.83.133.214/XGetImage_sysprof.syscap.bz2
Not even the detection in which shared library the function is seems
to work - most functions are simply listed directly below Xorg.
I remember this worked well some time ago (even on i386), and was
extremly useful for system-wide performance tuning / bottleneck
search.
My system has selinux as well as the meltdown/spectre mitigations
turned off - however could it be some of the security enhancements
introduced in the past (ASLR, ...) could cause these issues?
Thanks again, Clemens
[
Date Prev][
Date Next] [
Thread Prev][
Thread Next]
[
Thread Index]
[
Date Index]
[
Author Index]
