[gtkdatabox] Waterfall plots with gtkdatabox?
- From: "Getz, Robin" <Robin Getz analog com>
- To: "gtkdatabox-list gnome org" <gtkdatabox-list gnome org>
- Subject: [gtkdatabox] Waterfall plots with gtkdatabox?
- Date: Fri, 28 Nov 2014 00:46:22 +0000
Hi.
I was wondering if anyone had done any waterfall plots with gtkdatabox?
For those not familiar, have a look at:
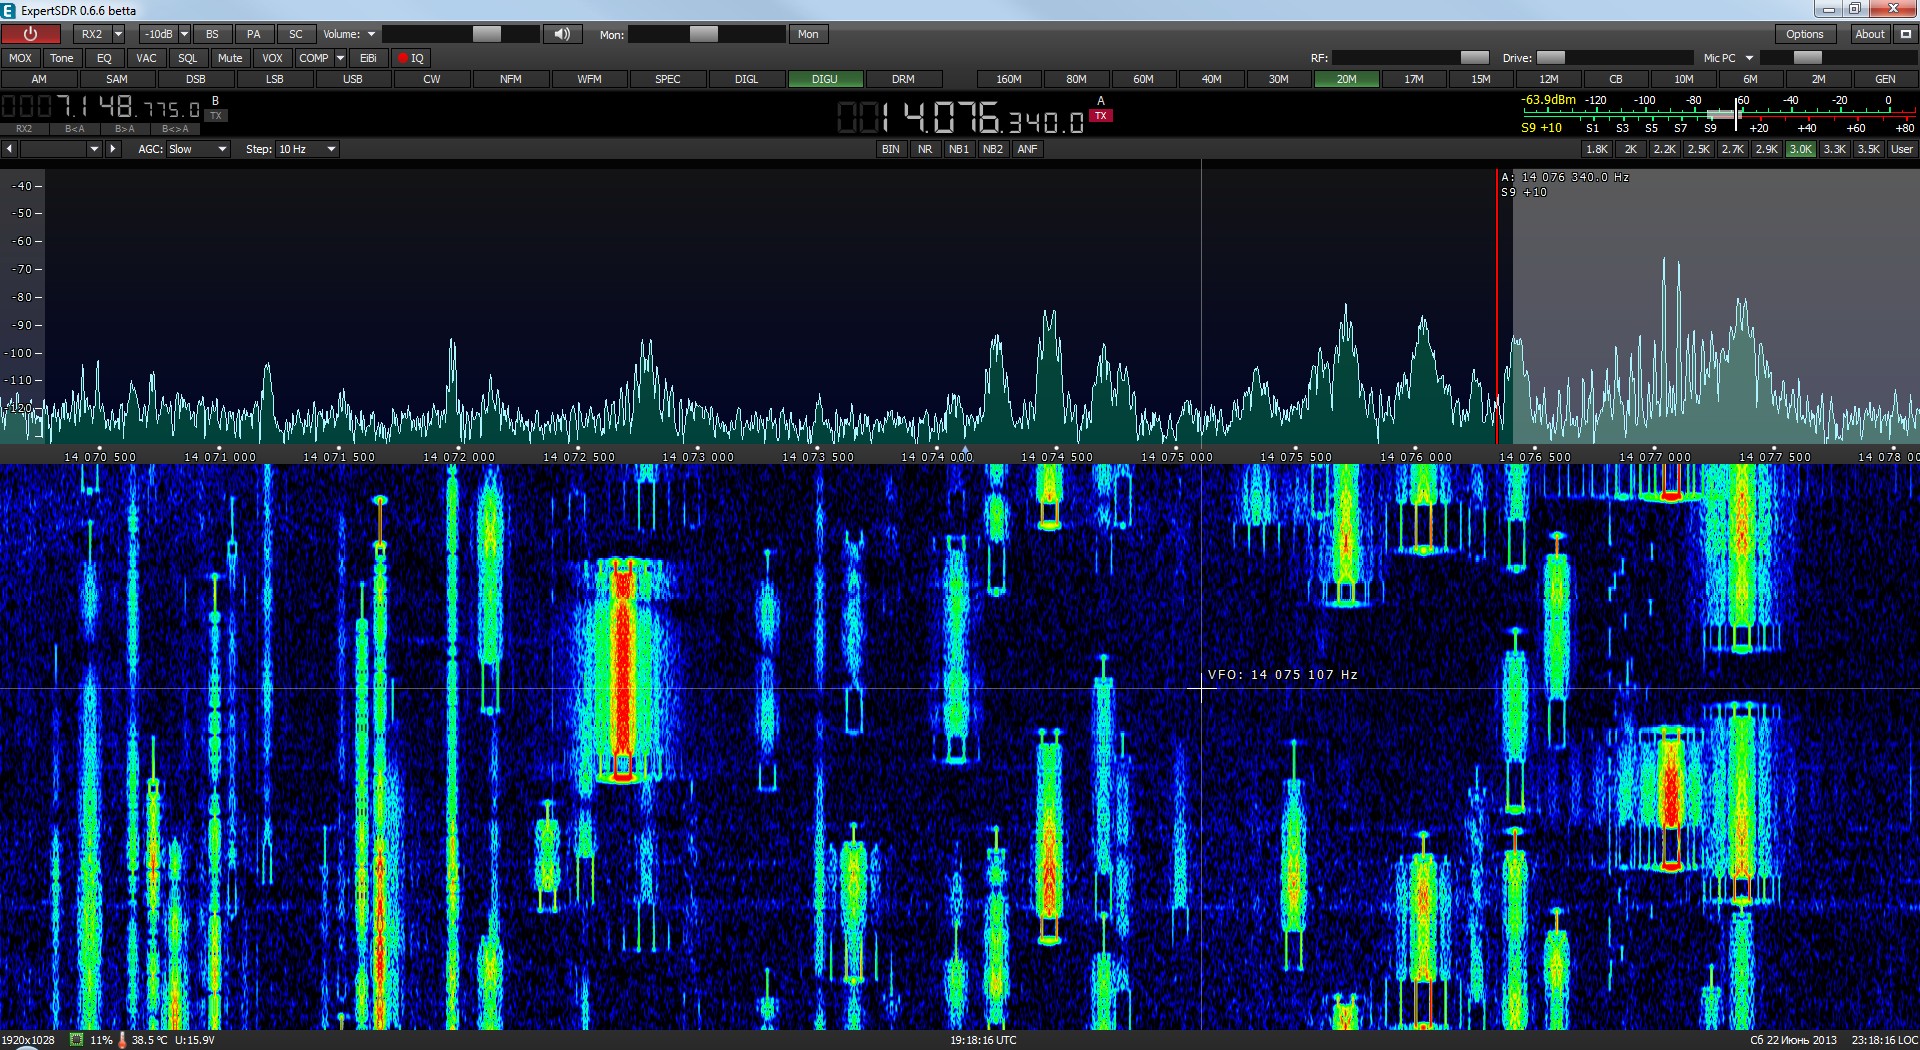
http://www.cqham.ru/foto/data/500/ESDR29.jpg
the top half is just the fft of the data (X = amplitude, Y = frequency). This can be done pretty easily with
gtkdatabox as is. (and we do it).
the bottom half is the "waterfall", (where X = time (normally scrolls down, one line is a instant in time, Y
= frequency, and the color of the pixel is the amplitude).
This view makes it easier to see time varying signals. For example, when you can "see" when a something that
is hopping frequency, changes:
http://i.imgur.com/fue5b.png
This sort of thing exists a lot in test electronics, and SDR equipment.
http://www.testequity.com/Images/new/keysight/N9344C-750.jpg
http://www.customer.rohde-schwarz.com/live/rs/mediadb/psfile/image/47/FSVRside4bf1478d8891e.jpg
Has anyone done this in gtkdatabox?
I could great my own with gtk_databox_points_new(), but that seems pretty painful to manage everything
myself, and would make sense (if others see value in it), to do it mostly internal, and I would just need to
"add" lines.
Thoughts?
Thanks
-Robin
[Date Prev][Date Next] [Thread Prev][Thread Next]
[
Thread Index]
[
Date Index]
[
Author Index]
