
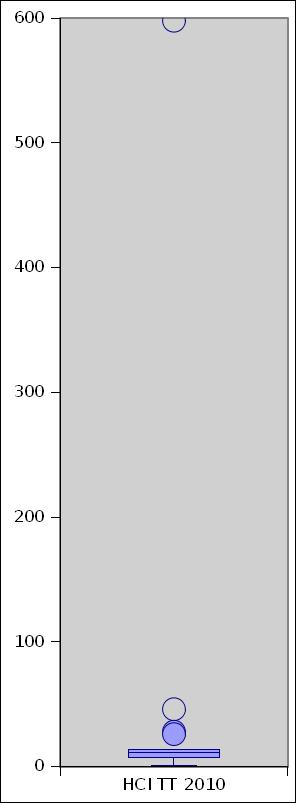
Jean,
thanks for your answer. However, I fear gnumeric does something else. I have a data set with one very strong
outlier, much farther out than 3* the IQ and according to this definition it should not be drawn. But it
does, so it definitely includes the maximum value.

I am quite happy gnumeric does not clip the values at 3*IQ, but I still would like to know what it does
exactly ...
Hannes

p.s.
here are my data:
HCI TT 2010
1
4
4
6
7
8
8
8
11
11
12
13
14
14
26
28
46
598


-----Ursprüngliche Nachricht-----
Von: Jean Brefort [mailto:jean brefort normalesup org]
Gesendet: Montag, 24. Oktober 2011 10:42
An: Kuehtreiber Hannes
Cc: gnumeric-list gnome org
Betreff: Re: outlieres in boxplots

The answer to your question is at
http://itl.nist.gov/div898/handbook/eda/section3/boxplot.htm

Regards,
Jean

Le lundi 24 octobre 2011 à 08:23 +0200, Kuehtreiber Hannes a écrit :
Hello everybody,

I am new to gnumeric, yet quite impressed by its  statistical
abilities.

Just did some boxplots, but I am missing information on how gnumeric
decides which data are outliers.

Could someone enlighten me?

Hannes

p.s. Tried google, but it did not come up with anything useful.

--

Mag. Hannes Kühtreiber

Tiroler Landesmuseen-Betriebsgesellschaft m.b.H.

Naturwissenschaftliche Sammlungen

Feldstraße 11a

A-6020 Innsbruck

Tel.: +43 (0) 512 59489-425

h kuehtreiber tiroler-landesmuseum at

_______________________________________________
gnumeric-list mailing list
gnumeric-list gnome org
http://mail.gnome.org/mailman/listinfo/gnumeric-list
Attachment:
outlier.jpg
Description: outlier.jpg