
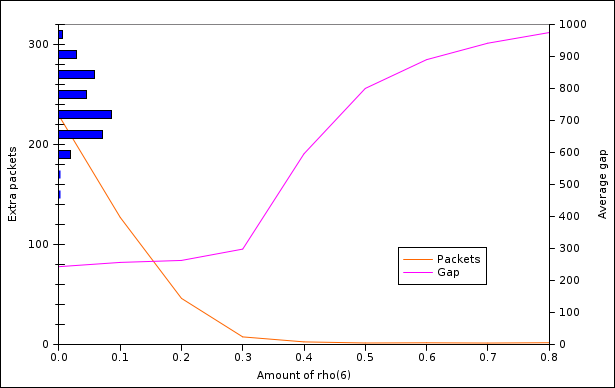
Hi

I am trying to plot a composite graph containing multiple histograms,
and I have run into difficulties. My basic question is this: is it
possible to automatically align a bar plot to the correct place on an
axis?

An incomplete example of what I want to make is attached, but there
should be a histogram at each point (0.0, 0.1, 0.2 etc.) along the
x-axis. The attached graph was created by adding a second x-axis and a
third y-axis, then manually adjusting the ranges to position the
histogram correctly. The histogram itself was created using the
histogram tool provided under Tools->Statistical Analysis.

Adding labels to a bar plot doesn't position it correctly along the
y-axis (it just chooses values 0.5, 1.5, 2.5 etc. as the y values for
each bar). Also for my purpose I need to be able to specify an offset to
each histogram (bar plot), which I'm not sure gnumeric supports.

It's possible that the (simple) enhancements to bar plots are wishlist
bugs. If you need me to send the gnumeric source file please ask.

Thanks

Olly Madge
Attachment:
graph1.png
Description: PNG image